About Graphical Analysis
Graphical Analysis™ is a tool for science students to collect, graph, and analyze data from Vernier sensors. Sensor data-collection support: • Vernier Go Direct(R) sensors - with Bluetooth(R) wireless technology
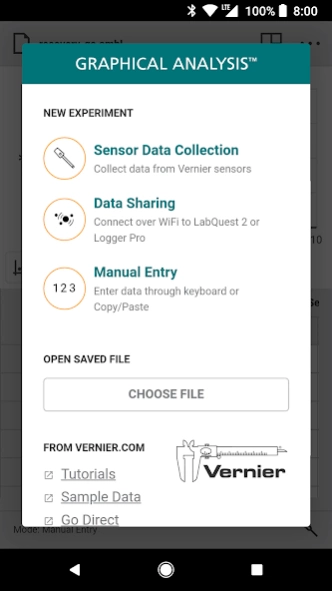
Graphical Analysis™ is a tool for science students to collect, graph, and analyze data from Vernier sensors.
Sensor data-collection support:
• Vernier Go Direct® sensors - with Bluetooth® wireless technology
• Vernier Go Wireless® Heart Rate and Go Wireless Exercise Heart Rate monitors
Additional experiment options:
• Data Sharing via Wi-Fi connection to LabQuest 2, LabQuest 3 or Logger Pro® 3
• Manual Entry
Note: Sensor data collection and Data Sharing require the purchase of hardware from Vernier Software & Technology. Manual entry of data can be performed without a hardware purchase. For more information on Data Sharing, visit http://www.vernier.com/css
Key Features - Data Collection
• Multi-sensor data-collection support
• Time Based, Event Based, and Drop Counting data-collection modes
• Configurable data-collection rate and duration for time-based data collection
• Optional triggering of time-based data collection based on sensor value
• Customizable unit display on supported sensors
• Sensor calibrations
• Option to zero and reverse sensor readings
• Graph match feature for use with motion detectors
• Manual entry of data from keyboard and clipboard
Key Features - Data Analysis
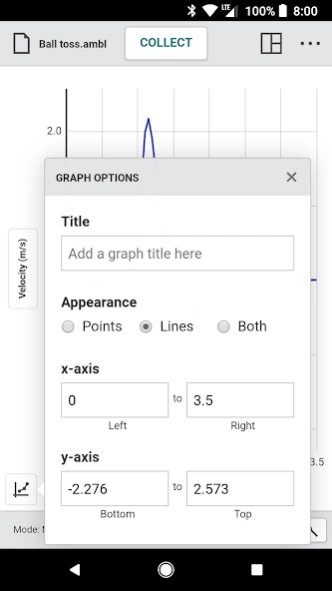
• Display one, two, or three graphs simultaneously
• View data in a table or show a graph and table side-by-side
• Draw Predictions on a graph to uncover misconceptions
• Examine, interpolate/extrapolate, and select data
• Use Tangent tool to show instantaneous rates of change of the data
• Find area under a curve using the Integral tool
• Apply Statistics calculations to find mean, min, max, and standard deviation
• Perform curve fits, including linear, quadratic, natural exponent, and more
• Add calculated columns based on existing data to linearize data or investigate related concepts
Key Features - Collaboration and Sharing
• Create text annotations and add graph titles
• Export graphs and data for printing and inclusion in lab reports
• Save files (.ambl file format) to the Cloud for exchange with Graphical Analysis on other Android™ devices, Chromebooks™, Windows® and macOS® computers, and iOS devices
• Export data in .CSV format for analysis of data in spreadsheet software such as Excel, Google Sheets, and Numbers
• Adjust font sizes for easier viewing when presenting to your class
Vernier Software & Technology has over 35 years of experience in providing effective learning resources for understanding experimental data in science and math classrooms. Graphical Analysis is a part of the extensive system of sensors, interfaces, and data-collection software from Vernier for science and STEM education.
Previous Versions
Here you can find the changelog of Graphical Analysis since it was posted on our website on 2019-07-13 13:00:07.
The latest version is 5.18.3 and it was updated on 2024-04-19 18:09:54. See below the changes in each version.
Graphical Analysis version 5.18.3
Updated At: 2023-10-17
Changes: • [FIX] Spirometer (SPR-BTA) and Blood Pressure (BPS-BTA) sensors now display live rate data correctly.
• [FIX] Photogate: Gate 1 and Gate 2 state meters now display reliably.
Graphical Analysis version 5.18.1
Updated At: 2023-10-03
Changes: • [FIX] Photogate: Linear Motion and Angular Motion calculated columns use correct step value
• [FIX] Photogate: Graph setup for Pulse timing uses correct column for y axis
• [FIX] Heart rate monitor rate() function calculations and beats per minute have been corrected
Graphical Analysis version 5.18.0
Updated At: 2023-07-18
Changes: • [PRO] Cross-data set calculated column functions.
• [NEW] Contextual selection menu updated for better usability.
• [FIX] Better handling of long units in the data table and column options dialog.
• [FIX] Local data sharing from LabQuest again works for multiple identical sensors.
Graphical Analysis version 5.17.2
Updated At: 2023-06-23
Changes: • [FIX] Crash associated with event-based data collection and calculated columns
Graphical Analysis version 5.17.1
Updated At: 2023-06-15
Changes: • [PRO] Units included in linear and proportional curve fits.
• [PRO] Right Y axis option.
• [NEW] Linked X axes in multiple graphs for simultaneous examine lines and grouped scaling.
• [NEW] Contextual menu for easy access to operations on graph selections.
• [NEW] Clearer behavior when user dismisses Welcome dialog without choosing a mode
• [NEW] Explicit confirmation when converting a column to categorical mode.
• [FIX] CSV file import
Graphical Analysis version 5.16.0
Updated At: 2023-03-09
Changes: • [PRO] Enhanced annotations functionality allows user to associate an annotation with a data point or a range of data.
• [PRO] 31 additional calculated columns now available.
• [PRO] If a Graphical Analysis Pro activation code is entered instead of license key, a descriptive error message is displayed.
• [FIX] Improved file fidelity to more closely restore full state upon file open.
• [FIX] Event-based data collection stability improvements.
Graphical Analysis version 5.11.0
Updated At: 2021-09-24
Changes: . [PRO] Histogram Mode now available in Graph Options.
. [NEW] Accessibility improvements for Selecting and Copying Text.
. [FIX] Fixed issue where replay mode would not display.
. [FIX] Fixed issue with Graph Draw.
Graphical Analysis version 5.12.0
Updated At: 2021-09-24
Changes: . [PRO] Categorical data entry is now possible.
. [NEW] Examine pin can now be moved with cursor keys.
. [NEW] Additional alt text is provided for greater accessibility.
. [CHANGE] New minimum operating system level of Android 8.
. [FIX] Improved drop counter calibration display.
. [FIX] Column order is again preserved when using local Data Sharing.
Graphical Analysis version 5.10.0
Updated At: 2021-07-15
Changes: . [PRO] Bar graph style option.
. [PRO] License and expiration date of Graphical Analysis Pro activation is now shown in welcome dialog.
. [NEW] Moved Graphical Analysis Pro activation field to bottom of welcome dialog and added option to ignore this field.
Graphical Analysis version 5.9.0
Updated At: 2021-06-24
Changes: . [PRO] Improved user assistance with input of Custom Calculated Columns
. [NEW] Pro features will now prompt for Authentication
. [FIX] Photogate pulse timing mode now gives correct result
. [CHANGE] GA Pro Authorization area moved to Welcome Screen
Disclaimer
Official Google Play Link
We do not host Graphical Analysis on our servers. We did not scan it for viruses, adware, spyware or other type of malware. This app is hosted by Google and passed their terms and conditions to be listed there. We recommend caution when installing it.
The Google Play link for Graphical Analysis is provided to you by apps112.com without any warranties, representations or guarantees of any kind, so access it at your own risk.
If you have questions regarding this particular app contact the publisher directly. For questions about the functionalities of apps112.com contact us.